|
If you're a pitcher, you want a lot of Ks (strikeouts) and few BB (base on balls). In 2018 Justin Verlander of the Houston Astros led the MLB in K:BB ratio. His ratio finished at 7.838, which was over 1 strikeout higher than the next best ratio. Was the key to his success a very small number of walks? Or did he have an overwhelming number of strikeouts that outweighed his walks. Verlander led the AL with 290 Ks, and only gave up 39 BBs in 214 innings pitched. Verlander's combination of a high amount of strikeouts combined with his low number of walks issued helped him to post such a high k:BB ratio.
0 Comments
Every team in the MLB plays a 162 game schedule. Should there be a tie for a berth to the playoffs, a list of tiebreakers is used, ending with a tiebreaker game. This year not 1, but 2 tiebreaker games were played in the NL this year. The Cubs played the Brewers for the NL Central title and the Rockies played the Dodgers for the NL West title. It is crazy to think that 162 games were not enough to separate 4 teams. 2009 was the last time there was a tiebreaker game to determine a divisional champ when he Twins defeated the Tigers 6-5 in the last Twins game to be played at the Metrodome.
The most common statistic used to measure a batters success is their batting average (BA). A batter's main objective is to find a way on base. This is where a batter's on base percentage (OBP) can show us more success than their BA. Only hits are towards BA, whereas OBP takes walks and errors into account. Out of the players with the top 6 OBPs Joey Votto's BA was .133 below his OBP and Brandon Nimmo's BA was .141 below his OBP. This goes to show that OBP is a better stat to measure how successful a batter. 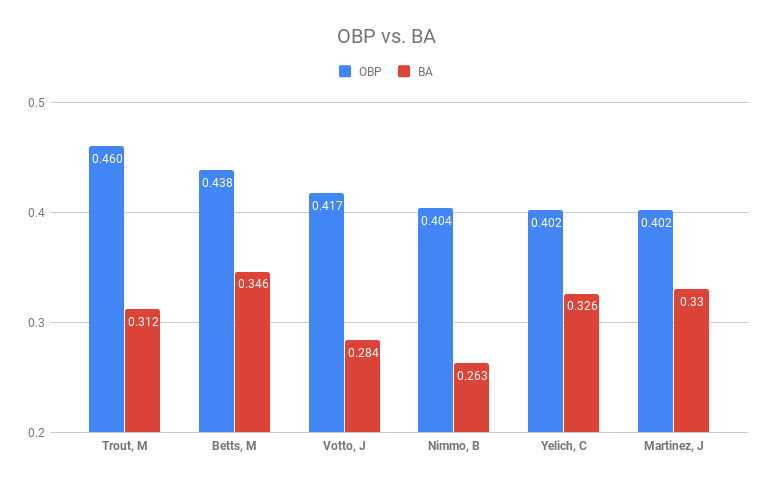 8 of the 10 hardest hit balls of 2018 belonged to Giancarlo Stanton of the New York Yankees, including the league leading 121.7 MPH ball. His launch angles range from -4.5 to 17.4 degrees resulting in a single and a home run, respectively. Ironically, 3 of these 8 hits by Stanton came of of Red Sox Pitcher David Price in 3 separate games. The bottom line is that Stanton can hit. Hard.
Having a high velocity fastball can help any pitcher, but now teams are looking at the RPM (rotations per minute) on these pitches. You'd think that the fastest fastball would have high the highest spin rate of any fastball. This however, is not true. Last season Carl Edwards Jr. led the MLB (pitchers with at least 150 fastballs thrown) with an avg of 2658 RPM on his fastballs. His fastballs averaged 94.5 MPH, ranking 135th in the league. Jordan Hicks threw the fastest pitch in 2018, coming in at a blazing 105.1 MPH. The average spin rate on his fastball was 2081 RPM, much lower than Edwards Jr. despite having an average fastball velocity of 100.5 MPH. Clearly a high spin rate does not directly equate to high velocity when it comes to fastballs.
The final count for the 2018 MLB season attendance was 69,625,244. This is the first time in 15 years that the total attendance has dipped below 70 million. Whose to blame? The weather. According to NOAA, through October this has been the 9th wettest year in the US on record. Since baseball cannot be played in overly wet conditions, the fan had to deal with lots of delays and rescheduled games. Nothing is worse as a fan than getting soaked while sitting at a game. With today's increased media coverage of the games, it is a lot easier for fans to follow the game from a mobile device if they'd rather not be in attendance. 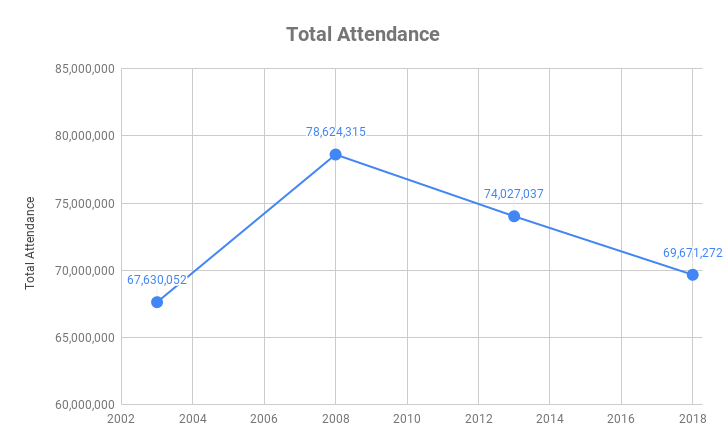 With the increasing use of sabermetrics in baseball, WAR has emerged as one of the more popular statistics. War (wins above replacement) is a stat that essentially determines how valuable a player is to their team. The higher the WAR, the more they have contributed to their teams success. Mookie Betts of the Boston Red Sox finished this season with the highest WAR of 10.9 which speaks of his MVP season. To have that high of a WAR and be on a World Series champions team shows you just hoe valuable of a player he was in 2018.
Christian Yelich of the Milwaukee Brewers just missed winning the Triple Crown. For those who don't know, the Triple Crown is given to a player of they leader their league in batting average, RBIs, and home runs. Very rarely does a player achieve this feat, or even come as close as the 26 year-old Yelich did. He had the NL's highest batting average of .326 but fell 1 RBI short of the league leading 111 and two home runs short of 38. Regardless of coming up short, Yelich won the NL MVP for his incredible season.
While the sacrifice bunt has been part of baseball for many years, it looks as if it may be a dying part of the game. In the past 10 years the number of sacrifice bunts in a season has nearly been cut in half. This may be due to the increasing number of defensive shifts used, however it will take a few more years to see if this trend levels out or continues towards extinction. Sacrifice flies on the other hand, have seen a slight decrease over the past 10 years, but do not ever seem to be headed for extinction as they are not as much of a voluntary strategy as bunting is. 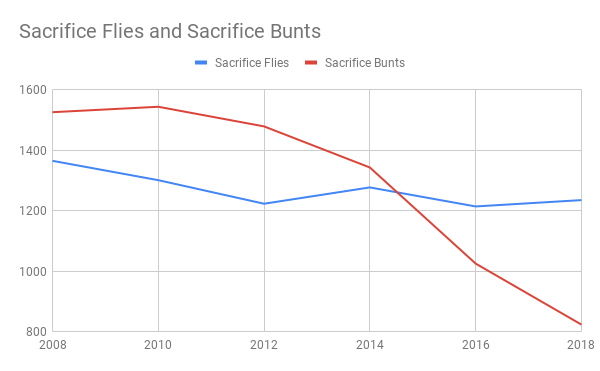 Now that the 2018 MLB season is over, we can look at various season totals and compare them to the previous years. At the end of the 2018 season the average batting average sat at .248 which is the lowest it has been since 1969. The MLB has seen a predominately downward trend in average batting average dating back to 2008. This may be in correlation with the rising number of total strikeouts in a season. 2018 saw 41,207 strikeouts which broke the all-time record set in 2017. Additionally, this is the first season in MLB history in which there were more strikeouts than hits.
|
 RSS Feed
